What is a Data Workflow?
Data workflows encompass the wider groups of processes that work on data to make it useful. In a simple way, a data workflow is a data pipeline.

Understanding Data Workflows
A data workflow is a series of steps or tasks that are performed on data in order to achieve a specific outcome or goal. These steps can include tasks such as data extraction, cleaning, transformation, analysis, and visualization. The overall process of a data workflow can be viewed as a pipeline, with data flowing through the different stages of the workflow until it reaches the final outcome. A data workflow can be automated or manual and can be used for a wide variety of applications, such as business intelligence, machine learning, and scientific research.
What is a Data Workflow Diagram?
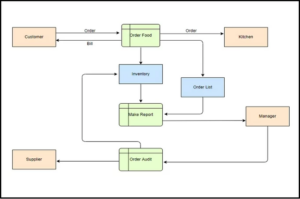
A data workflow diagram is a visual representation of the different steps and tasks involved in a data workflow. It typically includes a series of boxes or shapes that represent the different tasks, and arrows that show the flow of data between the tasks. The diagram also includes information such as the inputs and outputs of each task, and any dependencies or conditions that need to be met.
Data workflow diagrams can be used to document and communicate the structure and flow of a data pipeline, and to help identify potential bottlenecks or areas for improvement. They can also be used as a blueprint for building and automating data workflows. There are several types of data workflow diagrams, such as flowcharts, process flow diagrams, Swimlane diagrams, and Entity-Relationship diagrams.
For example, a flowchart is a type of diagram that uses boxes, diamonds, and arrows to represent the different tasks and the flow of data between them. A Swimlane diagram is a type of flowchart that separates the workflow into “lanes” to show the different roles or departments involved in the workflow. An Entity-Relationship diagram (ERD) is a diagram that represents the relationships between different entities in a data set, such as the relationships between customers, orders, and products in an e-commerce system.
In short, a data workflow diagram is a visual representation of the different tasks and steps involved in a data workflow, it helps to identify the flow of data, inputs and outputs, dependencies, and conditions, and it can be used to document and communicate the data pipeline.
Types of Data Workflows
There are several types of data workflows, including:
- Data Integration Workflow: This type of workflow involves the integration of data from multiple sources, such as databases, files, and web services. It includes tasks such as data extraction, data mapping, data validation, and data loading.
- Data Transformation Workflow: This type of workflow involves the transformation of data from one format or structure to another, such as converting data from CSV to JSON or flattening a nested data structure.
- Data Cleansing Workflow: This type of workflow involves the cleaning and validation of data to ensure that it is accurate and consistent. Tasks include data validation, data standardization, and data deduplication.
- Data Analysis Workflow: This type of workflow involves the analysis and exploration of data to gain insights and knowledge. Tasks include data visualization, data mining, and statistical analysis.
- Machine Learning Workflow: This type of workflow is used for building and deploying machine learning models. It includes tasks such as data preparation, feature engineering, model training, and model evaluation.
- Data Governance Workflow: This type of workflow is used to ensure that data is being used and shared appropriately. Tasks include data privacy, data security, data quality, data lineage, and data archiving.
- Business Intelligence Workflow: This type of workflow is used to extract insights from data and support decision-making. Tasks include data warehousing, reporting, and dashboarding.
Improving Data Workflows
Data workflows can be improved. They are never set in stone because business demands change, technologies change, vendors change, and different links in the data workflow become weaker relative to others as changes occur. The following methods can help improve any data workflow.
- Map and Document Data Workflows — This basic step contributes most of the benefit of using data workflows. Map flows to understand them. Map flows to understand if teams understand them.
- Identify Bottlenecks in Data Workflows — When teams understand their workflows, they can easily identify bottlenecks and potential bottlenecks. Analyze workflows against many scenarios to understand their weak points.
- Organize and Prioritize Tasks — After a complete mapping of current workflows, organizing and prioritizing the tasks can highlight where immediate improvements can be made. It may even highlight redundancies that hamper efficiencies.
- Leverage Automation — Data processing with automation is a textbook example of working smarter and not harder. Automation ensures reliability, consistency, and speed.
- Improve Team Communications — Maps of workflows given teams something to talk to each other about, and set their minds to improving. Ensure that the most fitting methods to communicate are available and accessible, whether that is zoom, in-person, or hybrid.
Benefits of Data Workflows
Formal data workflows are maps of the processes in a company. The act of sitting down and mapping out these processes provides the greatest benefit to companies—the chance to review their processes, and determine if they are achieving what they are meant to achieve, or adding redundant steps that only slow workflows. To these ends of effectiveness and efficiency, workflows must be revisited from time to time and compared against the company’s current agenda to redetermine whether workflows serve their purpose and do it well. In pursuit of that, data workflows benefit companies in many ways:
- Uncover Insight into Business Processes — Mapping out data workflows immediately uncovers whether a company understands itself or not. Data workflows follow and support business operations, so when they are confused it increases uncertainty in the business. Aligning data workflows with the business assists in uncovering real, actionable insights.
- Identify Redundant Steps or Whole Processes — Many business processes begin as ad hoc solutions to an immediate problem, and may eventually grow into a sustained use. Over time these ad hoc workflows introduce redundancy within the system. Mapped data workflows can help teams identify and eliminate redundant steps in workflows, or whole workflows that are no longer relevant.
- Reduce Micromanagement/Increase Reliability — Clearly understood data workflows bring to light their reliable data processes, which helps to eliminate the need for superiors to micromanage.
- Improved Internal Communications and Shared Understanding — As mapped workflows help increase process understanding, a centralized system of workflow maps can be shared among the entire organization elevating the shared understanding of all its members. This helps to improve internal communications as people understand what specific workflows do and how they impact other workflows.
- Improves Product or Service — What isn’t measured isn’t improved, as the adage goes. The workflow insight benefits that impact the company inside also extend to its product or services, by understanding the data workflows within a product or service, teams can measurably improve it.
- Improves Business Interactions — As with improvements in the product or service, mapped data workflows can be improved, and subsequently external business interactions are improved.
Steps in a Data Workflow
The steps in a data workflow can vary depending on the specific application and use case, but generally, a data workflow includes the following steps:
1. Data Extraction: The process of acquiring data from various sources such as databases, files, or web services.
2. Data Cleaning: The process of identifying and removing errors, inconsistencies, and irrelevant data from the extracted data.
3. Data Transformation: The process of converting data from one format or structure to another, and mapping data between different systems.
4. Data Loading: The process of loading the transformed data into a data warehouse or other storage system for further analysis and reporting.
5. Data Analysis: The process of exploring and analyzing the data to gain insights and knowledge. This can include tasks such as data visualization, data mining, and statistical analysis.
6. Data Modeling: The process of applying statistical or machine learning models to the data in order to make predictions or classify data.
7. Data Validation: The process of verifying that the data meets certain quality standards and that the results of the analysis are accurate.
8. Data Governance: The process of ensuring that the data is being used and shared appropriately, and that data privacy, security, quality, lineage, and archiving are properly handled.
9. Data Maintenance: The process of updating and maintaining the data over time, ensuring that it remains accurate and relevant.
Keep in mind that some steps may not be required depending on the use case, and some others may be added, but these are the most common steps in a data workflow.
Data Workflow Tools
Data workflow tools are software and platforms that are used to design, automate, and manage data workflows. They can be used for a wide variety of applications, such as data integration, data transformation, data analysis, and machine learning. Some examples of data workflow tools include:
- Apache NiFi: An open-source data integration and dataflow tool that allows for the design and automation of data workflows.
- Talend: An open-source data integration tool that provides a wide range of data integration, transformation, and data quality capabilities.
- Alteryx: A data integration and analytics platform that allows for the design and automation of data workflows, and includes features such as data blending, data preparation, and data analysis.
- Informatica PowerCenter: A data integration tool that provides a wide range of data integration, transformation, and data quality capabilities.
- Apache Airflow: An open-source platform to programmatically author, schedule and monitor workflows, it’s widely used in data engineering workflows.
- KNIME: An open-source data integration and data exploration tool that allows for the design and automation of data workflows.
- AWS Glue: A cloud-based data integration service that allows for the design and automation of data workflows and data preparation for use in analytics and machine learning.
- Google Cloud Dataflow: A cloud-based data integration service that allows for the design and automation of data workflows and data preparation for use in analytics and machine learning.
These are just a few examples of data workflow tools, many others exist and some are tailored to specific industries or use cases, like some ETL (Extract, Transform and Load) tools, BI (Business Intelligence) platforms, or even specific machine learning platforms.
Examples of Data Workflows
The following are some common example cases where data workflows are implemented.
- Data warehousing and reporting: Data is extracted from multiple sources, such as databases, files, and web services, and is loaded into a data warehouse. The data is then transformed and cleaned, and is used to create reports and dashboards for business intelligence and decision making.
- Social media sentiment analysis: Data is extracted from social media platforms, such as Twitter and Facebook, using APIs. The data is then cleaned and transformed, and is used to perform sentiment analysis, such as identifying the overall sentiment of posts about a particular topic or brand.
- Fraud detection: Data is extracted from financial transactions, such as credit card transactions, and is used to detect patterns of fraudulent activity. The data is first cleaned and transformed, and is then analyzed using machine learning algorithms to identify potential fraud.
- E-commerce product recommendations: Data is extracted from customer browsing and purchase history, and is used to recommend products to customers. The data is first cleaned and transformed, and is then analyzed using collaborative filtering or matrix factorization to generate recommendations.
- Healthcare data analysis: Data is extracted from electronic health records, such as patient information and lab results, and is used to analyze patient outcomes and identify potential health risks. The data is first cleaned and transformed, and is then analyzed using statistical analysis and machine learning.
- Weather forecasting: Data is extracted from weather sensors, such as temperature, pressure and humidity, and is used to forecast the weather. The data is cleaned, transformed and then analyzed using numerical methods and models to generate weather forecasts.
- Image processing: Data is extracted from images using computer vision techniques, such as object detection and image segmentation, and is used to extract information from the images. The data is first cleaned and transformed, and is then analyzed to extract information, such as identifying objects in a photo or detecting facial expressions in a video.
Ready to
see it in action?
See how the Reltio Context Intelligence Platform can give you the speed and flexibility you need to accelerate the value of your data and maximize its impact every day.