The Power of Connected Graph Technology for MDM

Back in 2018, knowledge graphs first appeared in the Gartner Hype Cycle for Emerging Technology. Graph Technology provides dramatic improvements in flexibility, enables real-time updates and offers advanced indexing capabilities.
There are a number of graph database companies citing the advantages of using standalone graph technology for master data management (MDM). This is because these graphs can capture relationships and provide very fast searches. As businesses focus on transforming the customer experience, the ability to leverage the relationships and connections in data to make timely operational decisions has never been more important.
However, standalone graph tools do not give users the most essential entity resolution and master data capabilities. These tools don’t offer capabilities for matching and merging records, creating survivorship rules and ensuring data quality. Also, these tools lack a “consumer-grade” interface, so instead of empowering business users across the organization, teams have to rely on IT to get the intelligence they need.
On the other hand, most legacy MDM tools do not enable teams to manage and search on relationships in the way that a MDM graph database technology can. For example, with a legacy MDM tool, it will be very difficult to run a query like, “find all patients who had heart surgery in the last six months, and who are linked to board-certified cardiac surgeons who are based in Southern California, have an advisory relationship with UCLA, and have spoken at one or more symposiums in the last two years.”
In trying to gain answers to questions like this, it is the relationships between the data points that matter more than the individual data points themselves.
But what if you could combine the advantages of graph technology and MDM? In his blog, “The Evolution of MDM” Malcolm Hawker, Sr Director Analyst at Gartner has talked about technologies driving the shift in MDM. He stated that “The growing use of graph and AI/ML technologies to assist in the automation of data quality and governance processes used by MDM software such as profiling, cataloging, lineage/process mapping, and relationship mapping, where these processes are increasingly run against large, non-relational data stores.”
By combining the strengths of graph technology with the advantages of a high-performance MDM environment, organizations can have the best of both worlds. With these capabilities, organizations can leverage high quality, clean and connected data.
The Strength of Graph Technology
In order to leverage data relationships, organizations need a database technology that stores relationship information as a first-class entity. This is the approach employed by graph-powered applications like Facebook. Applications that are built on relational databases are poor at handling data relationships because they are not capable of capturing complex and dynamic relationships in real-time.
The best way to manage relationships is by establishing a graph in which each node represents an entity (a person, organization, product or location), and each edge represents the relationship between two connected nodes. This general-purpose structure allows you to model all kinds of relationships—from suggesting complementary product purchases to identifying affiliations between doctors and hospitals.
To illustrate, let’s look at a simple use case example of publications written by scientists and referred to by other publications.

In this scenario, if a scientist’s publication is referenced by others, then he or she can be identified as an influencer, and this can be easily depicted by a graph model.
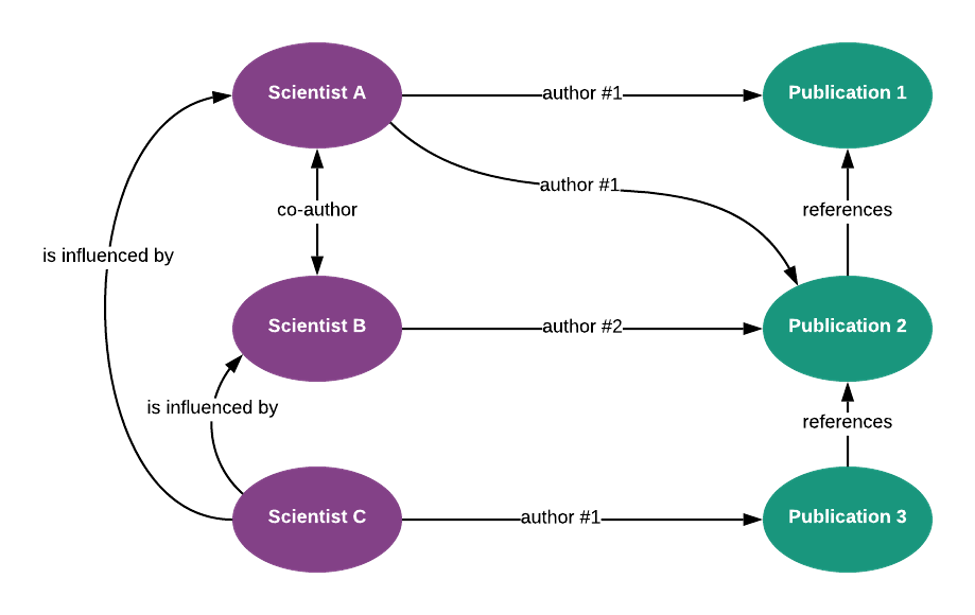
In the above example, we can see that scientist C is influenced by both scientists B and A, who also have co-authored publication 2. This information can be very useful when working with these scientists. For example, if you need any information from scientist C, you can ask scientists A or B to make introductions, since you know their work has had an influence on C. These insights reveal a sphere of influence across the entire population of records.
Graph Algorithms: PageRank
Today’s enterprises don’t just need to manage larger volumes of data—they need to generate greater insight from their existing data.
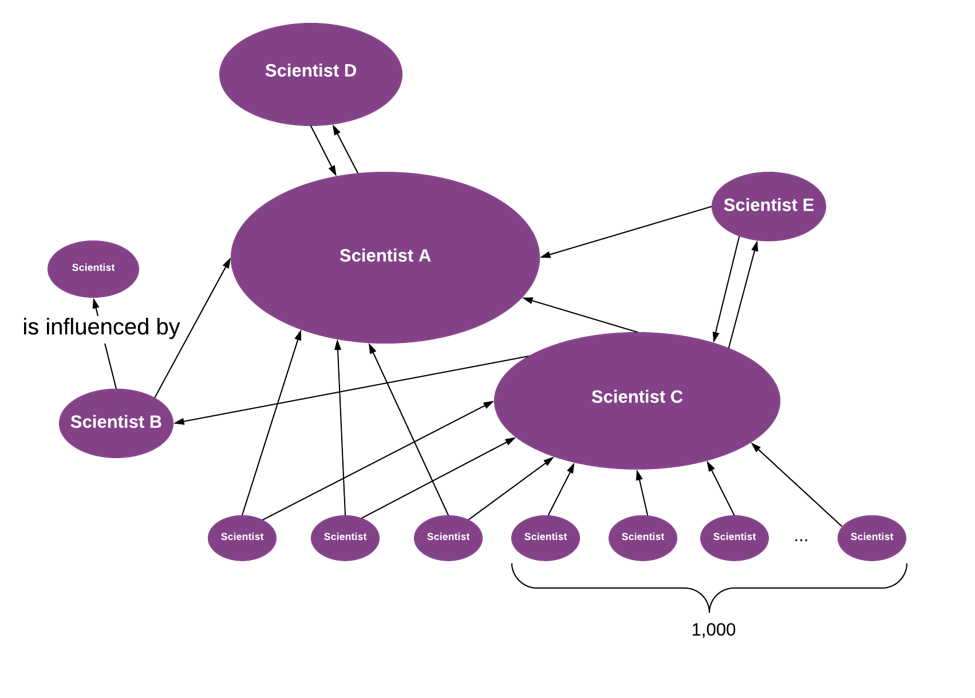
PageRank (named after Google’s Larry Page) is one of the graph algorithms that measure the transitive influence of nodes in a graph. PageRank considers both the quality and the number of connections. This guides an estimation of how important the object is. For example, having just a few highly influential Instagram beauty-bloggers following and recommending your hair-care product may increase sales for more than having large numbers of non-influencer followers.
In our previous example of scientists, we could determine that a scientist who wrote just one publication last year is very influential because her paper was referenced in many other publications, especially by authors who are also influential in the domain. Let’s review a graph of scientists/influencers that is derived from references in publications and see how PageRank will identify the most influential scientists:
The Criticality of Clean, Mastered Data
For graph analytics, the need for clean, organized data is critical. Let’s take the example of page rank above.
Consider a database that contains 1000 data point records with a range of names similar to “John Smith” (top row). Each record is linked to 10 other people (bottom row) who are influenced by those in the top row.
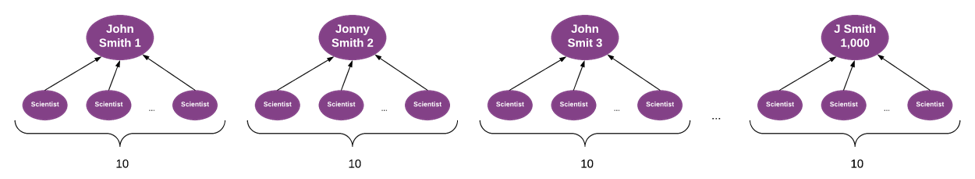
In its raw form, the graph processing suggests there are 1,000 unique scientists, each uniformly influencing 10 people. But this could be very misleading.
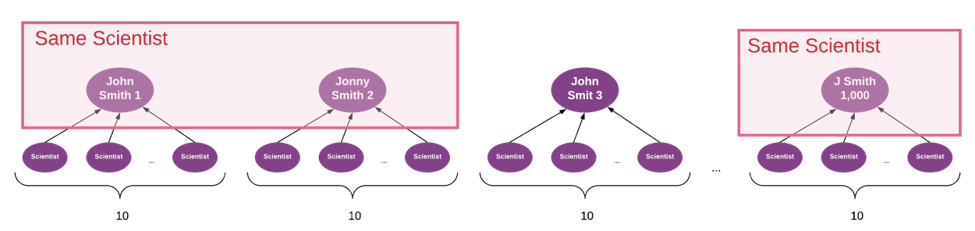
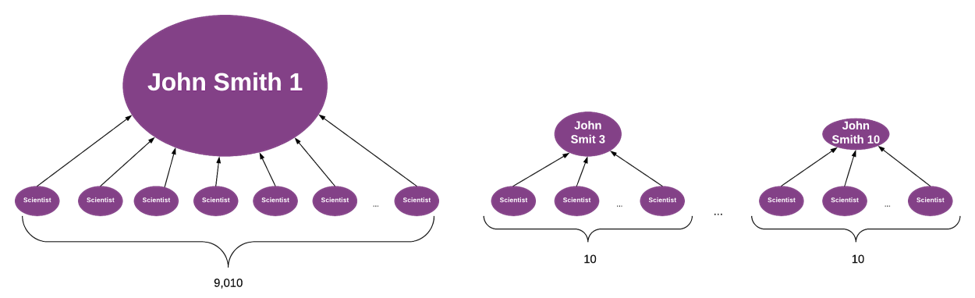
Suppose the 1,000 scientists in the top row really represent only 100 semantically unique scientists, and that after properly merging the semantically same scientists (and preserving the influence relationships during the merge process), you find that the logical merge of John Smith 1, John Smith 2, and J Smith resolves to a scientist who, based on the combined set of relationships, is a much more influential person than the others from that initial top row.
As a result, the page rank for that one record will be dramatically higher than all other records. The resulting business decisions based on this insight will be very different than the decisions that might have been made based on the raw data.
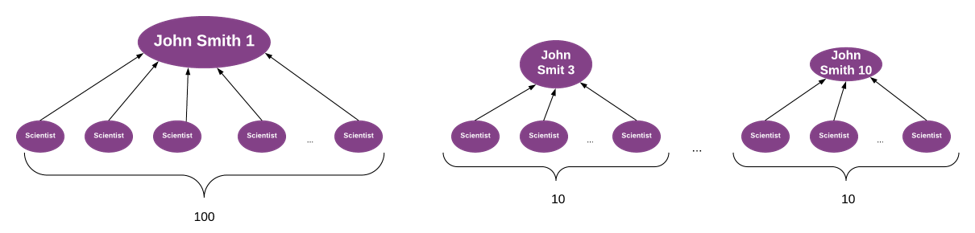
It is also essential to remember to organize relationships. Out of the 9,000+ relationships, there could be duplicates that should be merged, just as duplicate entries would be.
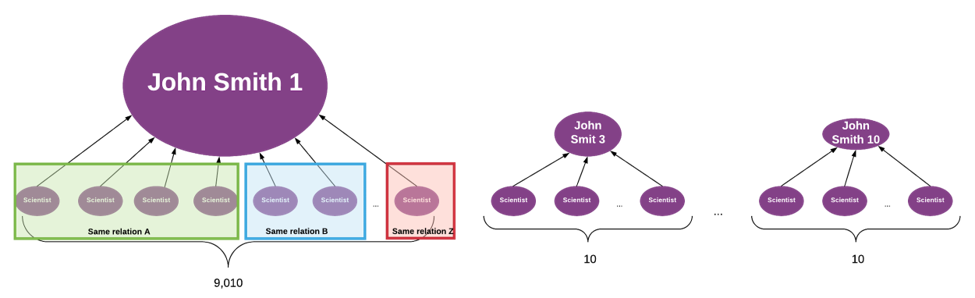
This will also affect the insights you draw from the graph.
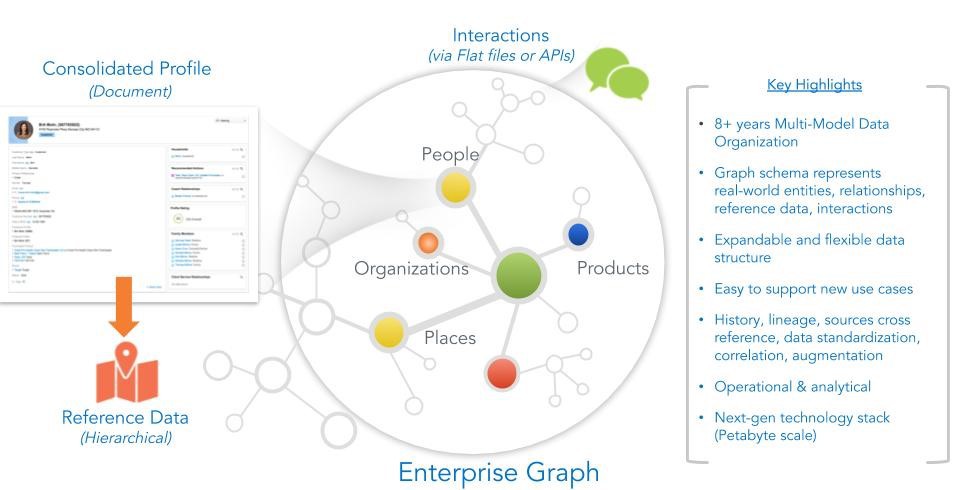
Only Reltio Connected Customer 360 combines the strengths of graph technology within a high-performance MDM environment. It is built on a multi-model architecture. This means it provides a single place in which you can bring together the three key types of data: entities, relationships and interactions. In addition, the platform enables you to leverage the benefits of real-time, operational use cases as well as analytical use cases.
Typical information models include:
- Consolidated profiles, such as people, organizations, products and locations.
- Relationships, including affiliations and employment.
- Graphs, including organizational hierarchies, employee reporting structures, families, product category hierarchies and so on.
- Interactions, such as phone calls, purchases and web site click-streams.
- Reference data and hierarchies, such as specialty codes and subcodes and address information (for example, where zip code can be associated with a city, a city with a county and so on).
Multi-Model Data Organization
Reltio Connected Customer 360 features Connected Graph™, a proprietary graph technology. Connected Graph offers a hybrid, columnar and graph data store that is based on a scalable big data architecture. This enables you to manage and connect an infinite number of attributes and relationships among people, organizations, products and places. This technology gives businesses the agility to scale up and down based on changing needs.
How does Reltio Connected Graph work?
- First, Reltio Connected Customer 360 consolidates data from all sources, including complex relationships and interactions. To promote cost-effectiveness, the platform stores interactions in economical cloud storage services like AWS S3, Google Cloud GCS, and Google BigQuery. The platform also brings in graph analytics as required, providing a pay-as-you-go option. Graphs are dynamically built from entities, relationships, attributes and interactions.
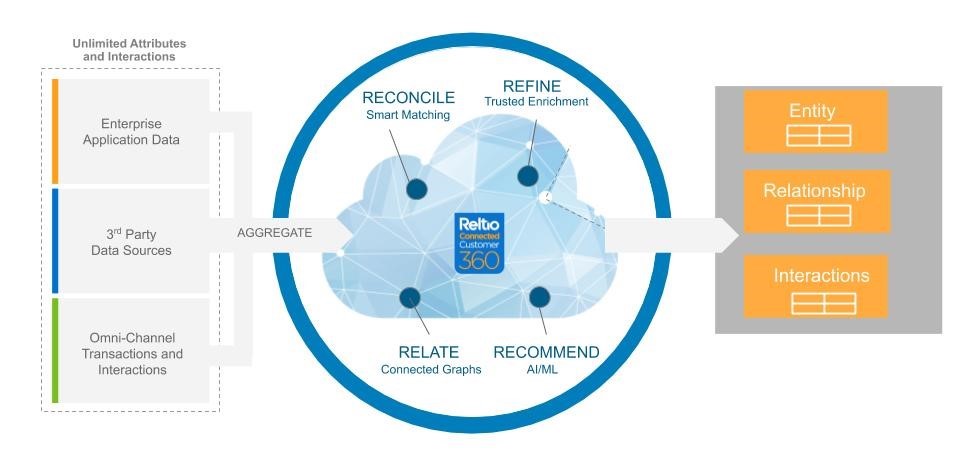
- Next, the graph analytics run on clean and holistic data created by aggregation, standardization, enrichment and unification. (This is based on the entity resolution and MDM with the PageRank algorithm, as outlined above)
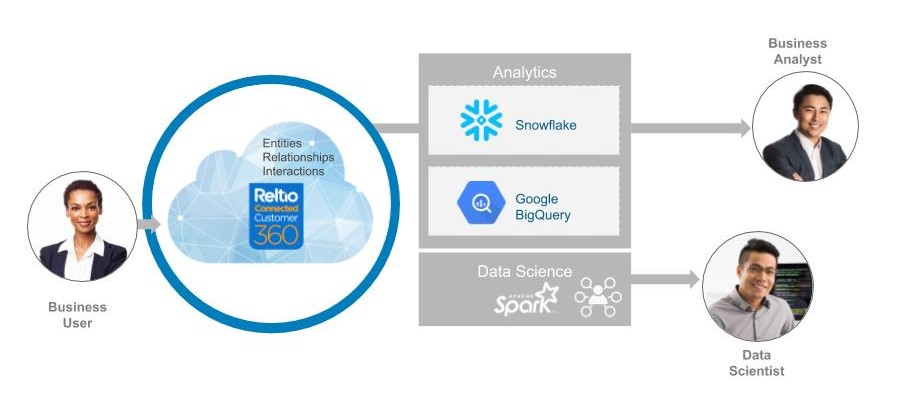
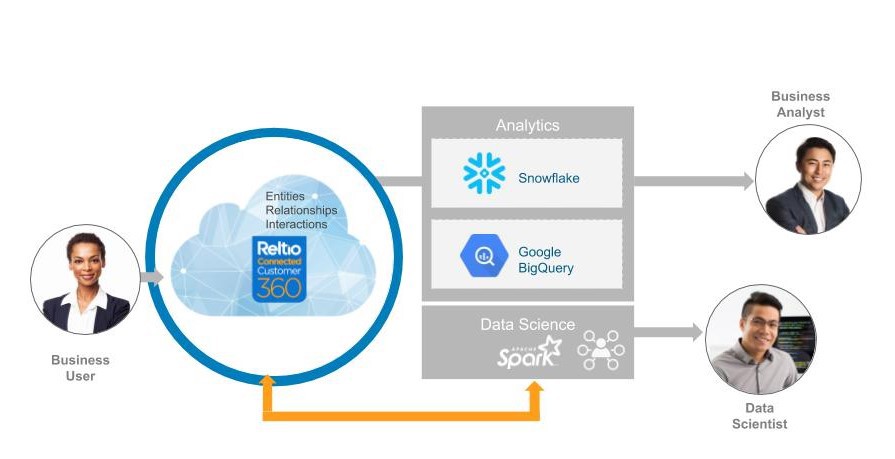
- Finally, insights are captured and enriched data is brought back to a central place. The data can then be consumed in a real-time manner by business users via a user interface and by downstream systems.
What Are the Potential Business Benefits of Connected Graph?
Connected Graph enables business people to build enriched sets of segments. Connected Graph can even provide interaction information linked to the mastered nodes of the graph. Following are some of the ways these capabilities can be used:
- A sales representative can focus on a high-value prospect, and rank the relative strength of all potential connection paths, in order to pursue the most effective sales approach.
- Marketing teams can more systematically identify and target influencers or decision makers in organizations and households.
- An operations manager can assess who represents the bottleneck in a network or supply chain.
- A store clerk can identify loyal consumers by connecting data from all store visits, including those made to the parent store and to franchises.
Conclusions
The powerful combination of MDM and graph technology is a classic case in which the whole solution is far greater than the individual parts, which makes it the best platform for clinical trials data management. Individually, neither MDM nor graph technology can provide holistic, connected and high-quality information across the enterprise. With the power of graph technology, Reltio has taken MDM to the next level, providing scalable and connected data.
To learn more, visit Reltio Connected Graph.