What is a data workflow diagram?
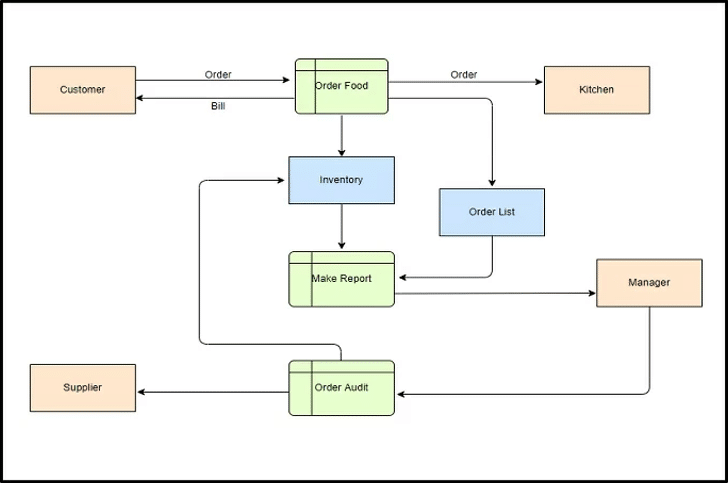
A data workflow diagram is a visual representation of the different steps and tasks involved in a data workflow. It typically includes a series of boxes or shapes that represent the different tasks, and arrows that show the flow of data between the tasks. The diagram also includes information such as the inputs and outputs of each task, and any dependencies or conditions that need to be met.
Data workflow diagrams can be used to document and communicate the structure and flow of a data pipeline, and to help identify potential bottlenecks or areas for improvement. They can also be used as a blueprint for building and automating data workflows. There are several types of data workflow diagrams, such as flowcharts, process flow diagrams, Swimlane diagrams, and Entity-Relationship diagrams.
For example, a flowchart is a type of diagram that uses boxes, diamonds, and arrows to represent the different tasks and the flow of data between them. A Swimlane diagram is a type of flowchart that separates the workflow into “lanes” to show the different roles or departments involved in the workflow. An Entity-Relationship diagram (ERD) is a diagram that represents the relationships between different entities in a data set, such as the relationships between customers, orders, and products in an e-commerce system.
In short, a data workflow diagram is a visual representation of the different tasks and steps involved in a data workflow, it helps to identify the flow of data, inputs and outputs, dependencies, and conditions, and it can be used to document and communicate the data pipeline.

Types of data workflows
There are several types of data workflows, including:
- Data Integration Workflow: This type of workflow involves the integration of data from multiple sources, such as databases, files, and web services. It includes tasks such as data extraction, data mapping, data validation, and data loading.
- Data Transformation Workflow: This type of workflow involves the transformation of data from one format or structure to another, such as converting data from CSV to JSON or flattening a nested data structure.
- Data Cleansing Workflow: This type of workflow involves the cleaning and validation of data to ensure that it is accurate and consistent. Tasks include data validation, data standardization, and data deduplication.
- Data Analysis Workflow: This type of workflow involves the analysis and exploration of data to gain insights and knowledge. Tasks include data visualization, data mining, and statistical analysis.
- Machine Learning Workflow: This type of workflow is used for building and deploying machine learning models. It includes tasks such as data preparation, feature engineering, model training, and model evaluation.
- Data Governance Workflow: This type of workflow is used to ensure that data is being used and shared appropriately. Tasks include data privacy, data security, data quality, data lineage, and data archiving.
- Business Intelligence Workflow: This type of workflow is used to extract insights from data and support decision-making. Tasks include data warehousing, reporting, and dashboarding.
Improving Data Workflows
Data workflows can be improved. They are never set in stone because business demands change, technologies change, vendors change, and different links in the data workflow become weaker relative to others as changes occur. The following methods can help improve any data workflow.
- Map and Document Data Workflows — This basic step contributes most of the benefit of using data workflows. Map flows to understand them. Map flows to understand if teams understand them.
- Identify Bottlenecks in Data Workflows — When teams understand their workflows, they can easily identify bottlenecks and potential bottlenecks. Analyze workflows against many scenarios to understand their weak points.
- Organize and Prioritize Tasks — After a complete mapping of current workflows, organizing and prioritizing the tasks can highlight where immediate improvements can be made. It may even highlight redundancies that hamper efficiencies.
- Leverage Automation — Data processing with automation is a textbook example of working smarter and not harder. Automation ensures reliability, consistency, and speed.
- Improve Team Communications — Maps of workflows given teams something to talk to each other about, and set their minds to improving. Ensure that the most fitting methods to communicate are available and accessible, whether that is zoom, in-person, or hybrid.